● Active Production System Diagnostics & Developer Tooling Visual Verification Commercial Diagnostics Engine

Replacing Opinionated PDF Audits With Verifiable Visual Evidence

How Context & Muse architected an automated multi-viewport capture and diagnostic engine that links technical findings directly to interactive visual bounding boxes, DOM nodes, and prioritized remediation sprints.

Domain Web Performance, UX & Technical SEO
Core Challenge Generic 80-page automated PDF audits that clients ignore
Key Innovation Crop-relative DOM coordinate pins & interactive Evidence Drawer
Verification Mode Multi-device real rendering (Desktop, Tablet, Mobile)
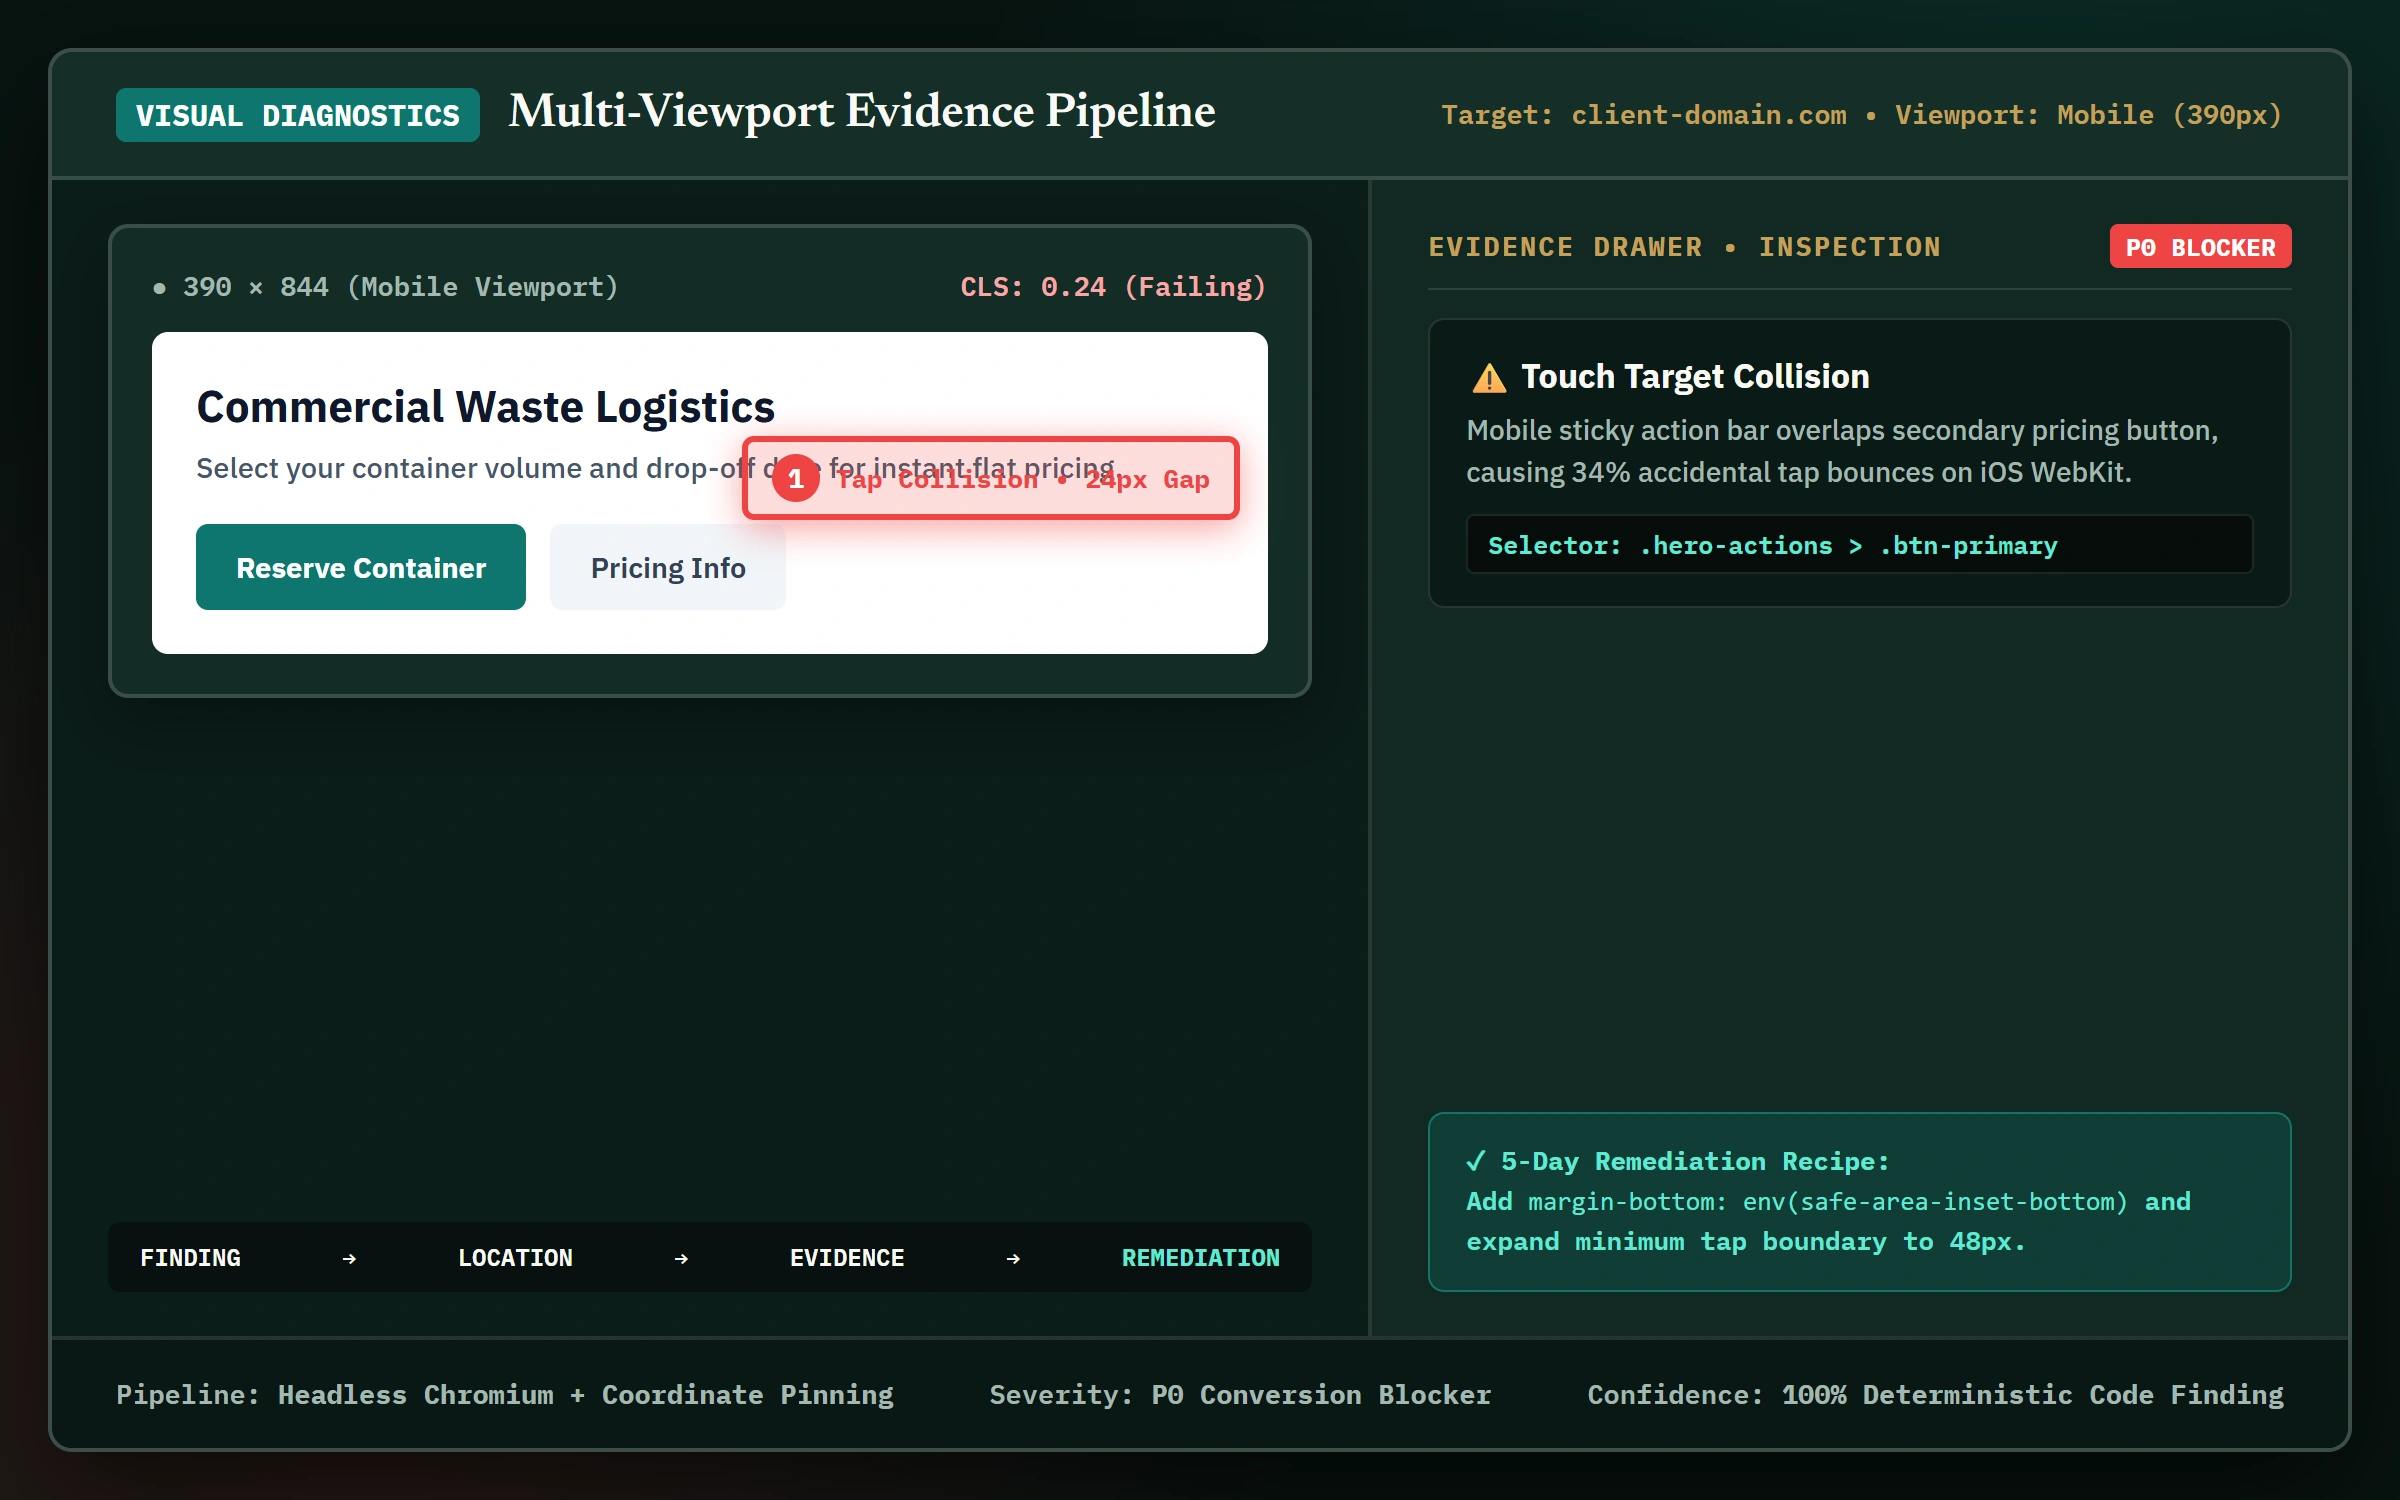
Website Audit System visual diagnostics interface with coordinate issue pins and Evidence Drawer
Fig 2.0: Website Audit System visual diagnostic pipeline with coordinate issue pins and Evidence Drawer. FINDING → LOCATION → EVIDENCE → REMEDIATION
01 / The Core Friction

The Flaw in Traditional Site Audits

Most digital agencies provide site audits generated by automated scrapers. These outputs suffer from two fatal flaws:

  • Disembodied Scorecards: A client receives a low score (e.g. "Performance: 48/100") without seeing where the layout shifts or broken contrast actually appears on their real mobile layout.
  • Unranked Noise: Hundreds of trivial warnings (missing alt tags on decorative icons) drown out critical conversion roadblocks (a sticky CTA overlapping the form submit button on mobile).

"How do we turn an audit into an undeniable visual evidence file that engineering and business stakeholders can instantly understand and act upon?"

02 / The Pipeline

Automated Visual Evidence Pipeline

The Website Audit System executes a headless browser capture workflow across three standardized viewports: Mobile (390px), Tablet (768px), and Desktop (1440px).

Step 1
Multi-Viewport Render
Renders pages under strict network throttling and layout shift recording across all 3 viewports.
Step 2
DOM Pin Calculation
Calculates exact viewport-relative bounding boxes for failing elements (broken touch targets, text overlaps).
Step 3
Evidence Drawer Synthesis
Binds each finding to a visual crop, exact CSS selector, impact severity, and step-by-step fix recipe.
03 / Diagnostic Integrity

Representing Honest Uncertainty

A major architectural decision was eliminating false certainty. Unlike generic tools that report fabricated revenue impact, the system categorizes findings with strict confidence tiers:

🔒 Verified Technical Defect
Deterministic failures: missing canonicals, broken schema JSON, overlapping z-index elements, or failing tap targets.
💡 Qualitative UX Friction
Heuristic observations: ambiguous CTA copy, multi-column friction on mobile, or buried pricing tiers requiring user testing.
04 / Deliverable Design

From Findings to a 5-Day Sprint

Instead of leaving clients with a laundry list of 100 theoretical fixes, the audit engine automatically groups items into a prioritized Remediation Matrix:

  • P0 Blockers: Broken lead forms, mobile overflow clipping, and indexing errors.
  • P1 Conversion Wins: Sticky mobile action bars, pricing clarity, and tap target expansion.
  • P2 Structural Optimizations: Font loading strategies, WebP compression, and semantic microdata.